Reports
Reports Overview
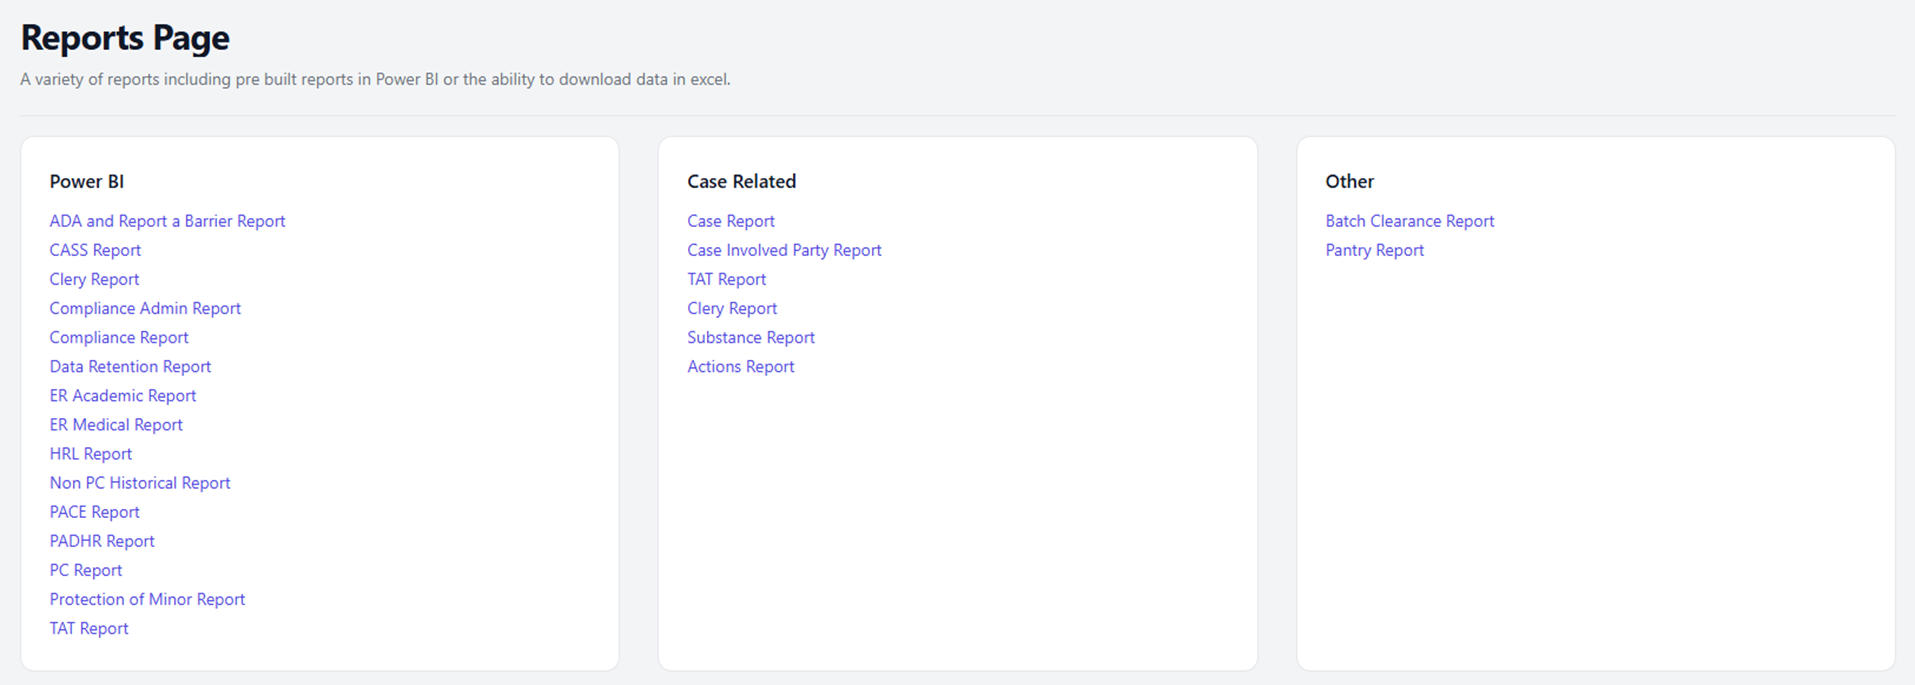
The Reports page provides access to a variety of reporting tools within SafeGrounds. Reports are organized by category and include interactive Power BI dashboards for data visualization and analysis, as well as case-related reports for generating detailed information about individual cases and activities. Users can also download data in Excel format for further processing.
Power BI Reports
Power BI reports provide interactive dashboards and visualizations that help users analyze trends and gain insights from incident data. Each classification within SafeGrounds has its own set of dashboards allowing users to monitor key metrics such as incident types, frequency, and locations.
These dashboards enable users to view aggregated data, identify patterns, and track performance over time. Reports open in a new window for interactive data exploration and analysis.
Users can also track employee case workload through the Team Member Page, which displays case assignments, workload distribution, and activity levels for individual staff members. This helps supervisors and administrators monitor team capacity and ensure balanced case management across the organization.
Case Related Reports
Case-Related Reports provide detailed information about cases and other case-related data within SafeGrounds. Users can generate, view, and download these reports to track incidents, review actions, and monitor trends at the case level. Access may vary based on your role and permissions.
| Report | Description |
|---|---|
| Case Report | A case report filtered by incident classification showing key case details and status information |
| Case Involved Party Report | A case report organized by involved parties within a selected classification to highlight patterns or trends |
| Actions Report | A case report filtered by classification and then by action, sanction, or violation |
| Substance Report | A case report broken down by substances involved outlining trends and case details tied to specific substances |
| TAT Report | A case report limited to cases flagged as TAT or TAT Contact |
| Clery Report | A case report that includes only incidents classified as Clery-reportable |
Other Reports
To use these reports enter as many IDs as needed into the text box. Separate each ID with a comma then click the blue Generate Report button to run the report.
Batch Clearance Report
The Batch Clearance Report shows whether an individual has any active or historical cases across key administrative areas. Enter UVA IDs to run this report.
For each person the report displays the number of cases in:
- PC — Personal Conduct
- PACE — Student Affairs
- HRL — Housing & Residence Life
- UJC / Honor — University Judiciary Committee or Honor System
Pantry Report
The Pantry Report provides basic background information for each person included in the search. Enter University IDs (not UVA IDs) to run this report. For each person the report displays basic information about the individual and whether the person is a student or an employee.
Downloading Report Files
Once generated your report will download automatically. If you don't see it immediately:
- Chrome/Edge — The file will appear in the lower-left or upper-right corner of the browser window
- Safari/Firefox — The file will appear in the Downloads bar or in your Downloads folder
- You can always open the file directly from your system's Downloads folder